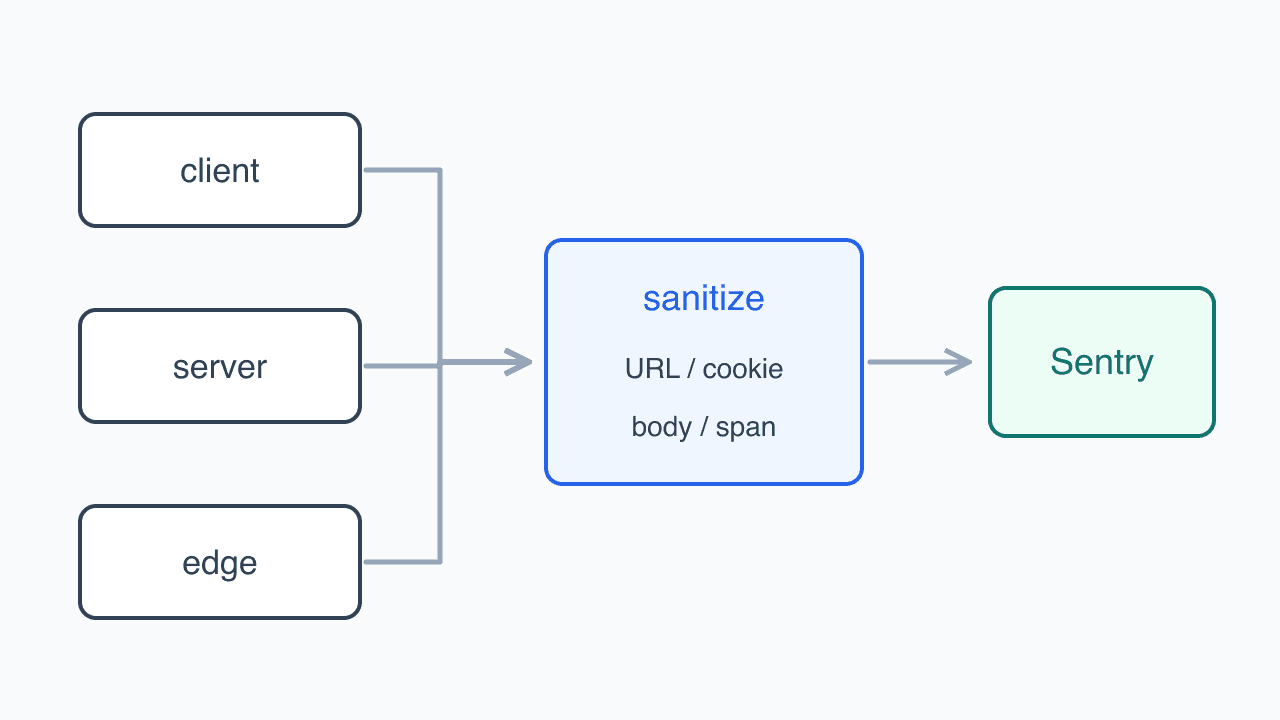
Sanitize sensitive data before sending client, server, and edge events.
I added Sentry to inspect screen errors and Web Vitals in the benefits portal. Installing @sentry/nextjs and sending the first event was quick. Opening the payloads brought up the harder work: credentials had paths into events, metrics emitted by the browser were missing on the server, and a successful build had uploaded no source maps.
I moved between actual events and SDK source to trace those problems. I decided what must stay out of payloads, closed the gaps in each runtime, and then separated errors by their effect on users. The setup used Next.js 16 and @sentry/nextjs 10.70.
Collect errors from three runtimes
Initializing the browser SDK does not collect server errors. Next.js uses separate SDK implementations for the browser, Node, and Edge, so I connected initialization in each runtime.
// sentry.client.ts
Sentry.init({
  dsn: SENTRY_DSN,
  enabled: IS_SENTRY_ENABLED,
  environment: SENTRY_ENVIRONMENT,
  integrations: [
    Sentry.browserTracingIntegration({
      idleTimeout: SENTRY_IDLE_TIMEOUT,
    }),
  ],
  tracesSampleRate: SENTRY_TRACES_SAMPLE_RATE,
});

// sentry.server.ts
Sentry.init({
  dsn: SENTRY_DSN,
  enabled: IS_SENTRY_ENABLED,
  environment: SENTRY_ENVIRONMENT,
  integrations: [
    Sentry.httpIntegration({
      disableIncomingRequestSpans: true,
      maxIncomingRequestBodySize: 'none',
    }),
  ],
});
The browser initializes in instrumentation-client.ts. instrumentation.ts register() selects Node or Edge initialization. I also connected captureRouterTransitionStart to capture navigation transactions from the start of route changes.
Next.js onRequestError receives failures from server component rendering, Route Handlers, Server Actions, and proxy. Errors already collected by an API interceptor are not sent again.
The same error could now pass through several collection points. An object reported by an API interceptor could reach the boundary and onRequestError and become separate issues. captureError marks handled objects with a non-enumerable symbol, which the later collectors check before sending.
Filtered errors need that mark too. Otherwise, a boundary can send an error as fatal after the interceptor deliberately excluded it.
Check the scope of automatic request collection
I first traced what sendDefaultPii: false actually removed. In 10.70 it did not exclude every header and cookie from event.request. Authentication cookies could be included too; I have renamed them sessionToken and renewalToken here.
The option transformed header/cookie collection into a deny-list object rather than false. requestDataIntegration checked only for false; an object enabled collection without applying the deny list. The filtering existed on the span path only.
Request context can help debugging, but this service handles medical information. I explicitly disabled headers, cookies, bodies, queries, and user input in dataCollection so credentials and entered content would stay out.
export const SENTRY_DATA_COLLECTION = {
  userInfo: false,
  cookies: false,
  httpHeaders: { request: false, response: false },
  httpBodies: [],
  urlQueryParams: false,
  genAI: { inputs: false, outputs: false },
  databaseQueryData: false,
  graphQL: { document: false, variables: false },
  stackFrameVariables: false,
  frameContextLines: 5,
};
AI input/output is disabled because counseling prompts and answers can contain user-entered content. GraphQL and database instrumentation are not currently used, but start disabled if later integrated.
stackFrameVariables matters too. Node's localVariablesIntegration adds exception-frame local variables, which could include member data or tokens.
I kept five frameContextLines. They expose source rather than user input, and the destination is our internal Sentry, so I kept them for debugging. Node events still contain minified lines because I do not upload server source maps; I explain that choice below.
Make new collection keys fail type checking
Supplying a dataCollection object does not disable entries I leave out. Omitted keys default to full collection. The first configuration missed stackFrameVariables and graphQL, which made another omission during an SDK upgrade easy to imagine.
The SDK type alone could not prevent this because every property was optional.
type TSentryDataCollection = NonNullable<NonNullable<Parameters<typeof init>[0]>['dataCollection']>;

type TClosedDataCollection = Required<Omit<TSentryDataCollection, 'queryParams'>> & {
  httpHeaders: Required<NonNullable<TSentryDataCollection['httpHeaders']>>;
  graphQL: Required<NonNullable<TSentryDataCollection['graphQL']>>;
  genAI: Required<NonNullable<TSentryDataCollection['genAI']>>;
};
Making the properties required causes type checking to fail on a new SDK field until I decide its value.
Types still allow an existing value to change accidentally to true. A full-object toEqual test covers those values alongside missing keys. The type and test catch different ways collection could reopen.
dataCollection did not cover breadcrumbs
After headers and cookies were disabled, tokens still had a breadcrumb path.
The policy applies to automatic request data, not console breadcrumbs. Some code passed Axios error objects to console.error, and config.headers contained credentials.
I discarded console breadcrumbs entirely because the error event already records the failure.
Fetch, XHR, and history breadcrumbs lose query strings and hashes. Node HTTP breadcrumbs also store queries separately as http.query, which must be deleted.
export function sanitizeBreadcrumb(breadcrumb: Breadcrumb): Breadcrumb | null {
  if (breadcrumb.category === 'console') return null;
  if (!breadcrumb.data) return breadcrumb;

  const data = { ...breadcrumb.data };

  ['url', 'from', 'to'].forEach((key) => {
    const value = data[key];

    if (typeof value === 'string') {
      data[key] = stripUrlParams(value);
    }
  });

  delete data['http.query'];
  delete data['url.query'];
  delete data['http.fragment'];

  return { ...breadcrumb, data };
}
Values the application adds to context sit outside those automatic collection settings too. I changed the code attaching screen and request locations so it would not send raw URLs.
- Use pathname rather than location.href for screen location.
- Remove query and hash from API URLs.
- Collapse numeric/UUID path segments to :id, reducing personal data and issue fragmentation.
- Keep OAuth code/state, search conditions, and member identifiers out of URLs sent to Sentry.
Block reading and sanitize before sending
Code review and SDK inspection found more URL and body paths after the header and breadcrumb changes. An option that sounded like a restriction on the whole request could apply to just one field or integration.
urlQueryParams: falsedisabled event.request.query_string only. The URL itself still carried its query.- The browser lacked the integration applying that option. Defaults attached full location.href and Referer to events and pageload transactions.
httpBodies: []did not stop Node httpIntegration reading incoming bodies with default medium size and placing them on scope. Event request-data collection then attached the scoped body, potentially including identity-verification callback POSTs.
I therefore restricted both reading and final transmission independently of collection policy. Node first disables body reading.
Sentry.httpIntegration({
  disableIncomingRequestSpans: true,
  maxIncomingRequestBodySize: 'none',
});
I also retained disableIncomingRequestSpans. Supplying httpIntegration replaces Next.js Sentry's same-named default Http integration, which enables that setting. Omitting it would duplicate incoming request spans between Next.js and Sentry.
Before transmission, another pass sanitizes events.
Sentry.init({
  beforeBreadcrumb: sanitizeBreadcrumb,
  beforeSend: sanitizeEvent,
  beforeSendTransaction: sanitizeEvent,
  beforeSendSpan: sanitizeSpan,
  dataCollection: SENTRY_DATA_COLLECTION,
});
Node now avoids reading bodies, while the final hooks remove request data and span attributes still present in events. They delete cookies and bodies again even where dataCollection already blocks them. I kept both the restriction on reading and the cleanup of the final payload.
A URL placed under a new SDK key can still escape a sanitizer that does not know its name. Upgrades require inspecting the URL fields and span attributes again.
sanitizeEvent handles:
- Removing query/hash from event.request.url
- Deleting query_string, cookies, and data
- Sanitizing Referer regardless of header case
- Cleaning trace and child-span attributes
URLs appeared under several keys.
const URL_ATTRIBUTE_KEYS = ['url', 'url.full', 'http.url', 'http.target', 'http.request.header.referer'];

const QUERY_DATA_KEYS = ['http.query', 'url.query', 'http.fragment'];
Plain url was the last one found. Fetch/XHR instrumentation put a cleaned URL in http.url or url.full while retaining the original under url. Our API calls use Axios/XHR, so every queried URL left its original query there. Until I added url, cleaned and uncleaned values traveled in the same span.
Standalone spans such as INP do not pass through beforeSendTransaction. The same attribute sanitizer therefore also runs in beforeSendSpan.
Check that initialization actually receives the sanitizer
A correct sanitizer still sends raw values if initialization never receives it. Alongside function tests, I check that client, server, and edge initialization receive dataCollection and every hook.
The sanitizer cases include URLs, bodies, cookies, differently cased Referer headers, breadcrumbs, and span attributes. The policy test compares all keys and values together. These protect known fields and connections, while new SDK attribute names still need inspection.
Verify Web Vitals in actual envelopes
Browser tracing sends LCP, CLS, TTFB, and FCP as pageload transaction measurements. Production tracing samples 20%; transmission-verification deployments collect all traces.
With the original one-second idleTimeout, pageloads missing LCP had a median duration of 728ms, while those with LCP lasted 2.3 seconds. I inferred that transactions sometimes ended before the metric and extended the waiting window to three seconds.
export const SENTRY_IDLE_TIMEOUT = 3_000;That does not add three seconds to recorded duration. The SDK trims idle span end time to the final child's end. Waiting and sending times change, rather than adding idle time to the measurement.
Unit tests cannot prove a payload survives browser tracing, activation gates, and sampling to leave the browser. I added a separate Playwright path.
npm run test:e2e:sentrypage.route intercepts the Sentry envelope without sending it to the real server. The test reads the transaction and checks fcp, lcp, and ttfb measurements.
Service workers are blocked in that context because MSW would otherwise receive the request before page.route. A synthetic success response prevents SDK retries.
The test follows the payload the browser actually builds:
브라우저 진입
  → browserTracingIntegration
  → pageload transaction 종료
  → Sentry envelope 생성
  → measurement 포함 여부 확인
The envelope contained the metrics, but some still did not appear in our Sentry dashboard.
INP was sent but not stored
The SDK sends INP as a standalone span rather than a pageload measurement. Our internal Sentry had span ingestion disabled and an empty spans dataset. INP was not stored, and Insights Web Vitals appeared empty.
We inspect LCP, CLS, TTFB, and FCP in Discover’s transaction dataset with transaction.op:pageload. Product-specific improvement thresholds and alerts are separate from that collection setup.
A client-side beforeSendSpan hook cannot enable ingestion on the server. The app emits INP spans; storing them requires changing the server configuration.
Connect agents to internal Sentry through MCP
Investigating meant switching repeatedly between the dashboard and code. I connected Sentry MCP to the repository so agents could read issues, transactions, and project settings while tracing the implementation.
@sentry/mcp-server runs over stdio with the internal host.
{
  "mcpServers": {
    "sentry": {
      "command": "npx",
      "args": ["-y", "@sentry/mcp-server@latest", "--host=sentry.example.com", "--disable-skills=seer"],
      "env": {
        "SENTRY_ACCESS_TOKEN": "${SENTRY_ACCESS_TOKEN}"
      }
    }
  }
}
Unavailable Seer tools are disabled. The repository references environment variable names rather than token values.
During setup, terminal curl succeeded while MCP authentication failed. Claude Code expands the token from its own process environment, but I had provided it only in local settings for Bash tools. It did not read .env.local either. Moving the token into the shell startup environment and restarting Claude Code made it available to MCP.
MCP and source-map uploads use separate tokens.
- MCP: a user auth token for issues, events, and project reads.
- Build: an organization token for releases and source-map artifacts.
The MCP token lacked project:releases and could not be reused for upload. Tokens for the same service had different purposes and scopes.
For INP, I used MCP to read the transaction dataset and issue payloads. Comparing them with browser emission pointed to disabled server span storage rather than an omitted client metric.
Verify releases and source maps in build artifacts
Mapping minified stacks requires artifacts actually present in Sentry. I connected internal host, organization, project, and build token through withSentryConfig.
withSentryConfig(nextConfig, {
  sentryUrl: '<https://sentry.example.com/>',
  org: 'example',
  project: 'web',
  authToken: process.env.SENTRY_AUTH_TOKEN,
  telemetry: false,
  widenClientFileUpload: true,
  sourcemaps: {
    disable: !process.env.SENTRY_AUTH_TOKEN,
    deleteSourcemapsAfterUpload: true,
  },
  errorHandler: (error) => {
    console.warn('[sentry] 소스맵 업로드 실패:', error.message);
  },
});
Stacks stayed minified for eight days after I added the source-map configuration. No deployment workflow had the build token, leaving sourcemaps.disable true. Upload was not failing; it was never being attempted in deployment.
I initially suspected Turbopack support. In 10.70, Sentry uploads through a post-production-compile hook; Next.js 16 creates debug IDs linking deployed files to artifact bundles.
Adding a token still did not make build success proof of upload. An expired or unauthorized token can produce a 401 while errorHandler only warns and lets the build finish. deleteSourcemapsAfterUpload can also remove local maps after a failed upload.
That leaves no maps in Sentry or the deployment output. I checked release access with sentry-cli and looked for the actual artifact bundle through the Sentry API.
I chose not to upload server source maps. Turbopack left more than 1,000 under .next/server, causing internal Sentry uploads to return 502 and accounting for about half of a 199 MB .next directory. Deleting server maps in an earlier build hook limited uploads to browser maps. In that build, .next fell to 93 MB and upload completed without 502. Server stacks remain minified as the tradeoff.
Connecting a deployed error back to source requires its debug ID to match the uploaded artifact. That match, rather than the build’s exit code, was what I checked at the end.
Assign severity by user impact
Once I could inspect the issues, I needed to decide which ones to act on first. An unavailable screen and a request someone can retry are difficult to distinguish if they arrive at the same level.
The starting points were Sentry operations at my previous company and Woowa Brothers' Sentry optimization article. Previously, I filtered extension, Service Worker, network, and already handled business errors with ignoreErrors, denyUrls, and beforeSend, and excluded development/test traffic. The lesson was to preserve user-impacting signals rather than collect everything.
The Woowa article starts with excess errors exhausting collection quotas and hiding important incidents. It combines impact-based levels, filtering, alerts, and ownership. I adapted those concerns to this app's runtimes, privacy needs, and deployment rather than copying its implementation.
HTTP status alone was insufficient: the same 500 has different effects depending on a request's role.
| Request | 5xx | 4xx |
|---|---|---|
| GET supplying screen data | fatal | error |
| Other calls users can retry | error | warning |
This app uses the table as a default distinction between failed screen-loading queries and actions that can be retried with the screen intact. The method alone does not describe every impact; I also check whether a core action is blocked or an alternative exists.
- fatal: the screen or essential queried content is unavailable
- error: the screen remains, but the intended action is blocked
- warning: an expected failure allows retry or an alternative flow
401 handling also varies. A 401 recovered through token refresh is not sent. Refresh failure receives a separate fingerprint: a normally expired refresh token is warning because returning users naturally reach session expiry; other refresh failures are error.
Attach only the member ID
Affected-user counts distinguish one unusual case from widespread failure. Browser issues receive only a member ID, without name, email, or phone. dataCollection.userInfo false prevents SDK IP collection.
Server renders do not receive user identity because request scope and cached-render lifetimes could otherwise retain a previous user's ID.
Components do not call SDK setUser directly. Shared setSentryUser controls both the transmission gate and permitted fields.
Sample environmental noise at its source
Geolocation failures filled the issue list after privacy cleanup. Permission denial is a user choice and is not sent. Unavailable positions and timeouts depend strongly on device/environment, so I retain 10% to detect spikes.
Failures without an error code are all retained; bridge rejection or missing navigator.geolocation may indicate broken application code.
ignoreErrors could only discard matching messages, not sample codes 2/3 while retaining uncoded errors. I moved that decision into geolocation code with access to the original code and included it in the fingerprint.
GeolocationPositionError is neither Error nor Event, so the SDK produced a stackless synthetic exception titled unknown. I wrapped it in a named Error with the original as cause, retaining the fingerprint to avoid splitting existing groups.
Gate transmission by execution purpose
At the previous company, NODE_ENV excluded dev/test events. It was effective but could not precisely represent production-build E2E or local transmission verification.
Errors already visible in a local console were mixing with real-user issues. This time I used an explicit transmission setting based on the run’s purpose rather than NODE_ENV.
export const IS_SENTRY_ENABLED = Boolean(SENTRY_DSN) && SENTRY_ENABLED !== 'false';Deployments collecting real-user errors and runs verifying Sentry transmission enable it. Ordinary local runs and development deployments keep it off. The dev, dev:mock, and build:e2e scripts default to false; transmission E2E and local integration checks can opt in explicitly.
I first put local disabling in .env.local. A new clone or worktree lacked that file and read the true value from .env.development. Moving the default into execution scripts made new workspaces start with reporting disabled too.
Problems this setup helped uncover
The Bottom Sheet drag crash initially showed 23 events across 17 users, reaching at least 75 events and 57 users before deployment. Following the dependency source led to upgrading to a version without the failing path.
While deriving types from Zod and narrowing nullability, I compared the change before merge against 33 existing production schema mismatches. A field populated in all 12 dev samples was null in 27 of 200 production responses. Restoring that nullability prevented new warnings on valid responses from obscuring real issues.
A Sentry waterfall also showed main-banner links prefetching several routes merely by entering the viewport. I disabled their prefetch and checked that those unnecessary requests stopped.
References
- Woowa Brothers: Sentry optimization for proactive incident response: starting point for impact levels and filtering
- Next.js: instrumentation.js: register() and onRequestError
- Next.js: instrumentation-client.js: browser initialization and onRouterTransitionStart
- getsentry/sentry-javascript: requestDataIntegration, sendDefaultPii defaults, and fetch/XHR attributes
- getsentry/sentry-mcp: the MCP server host option
- Related: Tracing a Bottom Sheet drag crash with Sentry
- Related: Letting failed sections recover with Error Boundaries